I'll look in some detail at the movement of water through Coed Y Brenin in part two but first I want to to talk about rainfall here at our site in Coed Y Brenin.
Way back in the 1980's, I was puzzled when hearing folk, both visitors and locals, complaining about it raining all day or all week or even “all the time”. Being an active outside sort of person this didn't seem to match my experience. To me, rain, when it came, was rarely continuous and often even a day of apparently incessant rain provided longer or shorter gaps for bursts of outside activity. This led me to coin the phrase “it is extremely unusual in Cymru for it to rain all day”. I also started noting the weather in my diary, using the sort of graphics you might find in any weather forecast, in order to have some evidence to counteract the complaints
above: diary weather icons. Simple but contain a fair bit of information.
I found I could squeeze a fair bit of information into the weather icons, such as how much cloud, when in the day the sun shone, if at all and when it rained during the day, plus an indication of intensity, where any breaks came, wind, storms etc.
The main problem with this sort of data source is that diaries being analogue, the only way you can search it is by thumbing through every page, or, as the years went by, going through the growing collection of diaries. The thing was and still is, I just find it so easy to do at the time and being pictorially minded, I like drawing.
So after five or so years of this I used some of the long winter evenings to trawl through, looking for patterns that might be useful in my work, particularly in gardening and sure enough, I found patterns. it seemed pretty clear that for most of the year we were subjected to repeated western fronts arriving every two, three or four days, sometimes five, leading to two or three days with rain and giving us two or three days of clearer weather in between, occasionally four and maybe twice a year, five; in other words, pretty wet weather…
The only exceptions to this pattern were sustained highs in the winter months which could see cold north or east winds for several weeks, up to about four, with temperatures around or below zero centigrade during the day and the ground frozen hard. Snow tended to arrive in two bursts, one before and one after the winter solstice and it could be heavy and lie for several weeks.
One glimmer of hope was a two week clear spell in the early spring which moved about a bit but over the five years of records I had accumulated, was relatively consistent. As a gardener I was able to take advantage of this several years running and get seedlings started before the slugs appeared.
However...no sooner had I identified this pattern and begun taking advantage of it, everything seemed to change. I was to learn later, from a radio 4 programme that looked at long term studies, that this was in fact normal.
Among other examples, the Radio 4 programme introduced an ecologist who began a four year study of arctic terns. After the four years was up he felt satisfied that he had identified the trend, understood what was going on and was prepared to write up his paper but he thought he'd go back for another year just to check
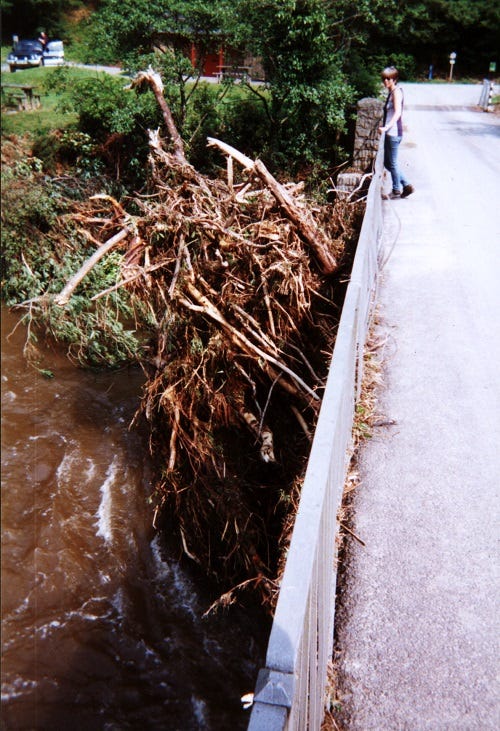
above: extreme weather. Debris left after the flash flood of 2001. The Mawddach was 24 feet above its normal height here. More on this in part two.
To his surprise he found that the trend he'd identified had disappeared and the situation had changed completely. He ended up returning every year to continue the study and observing trends disappearing almost as soon as he'd identified them. He was talking on the programme after, If I remember correctly, his 21st year of going to the arctic to observe the terns.
His main lesson was that had he presented his paper after just four years, it would have been wholly inadequate at capturing the complexity of the terns behaviour. The programme went on to give many examples of similar experiences. So too with the first five years of my weather recording. This is the inevitable consequence of dealing with complex systems- as soon as you think you've spotted a trend, the trend disappears and a new one appears, only to be replaced by another and so on.
It is also in our nature to look for and recognise patterns so we should be careful to not fall in love with them as they may not persist through time; instead we need to continue our objective observations, always open to changing circumstances- “Change is the only constant” as the Taoists say.
So here on the Mawddach river catchment in Cymru, from 1990 onwards,that regular pattern of western fronts every few days began to change and the two week window of clear skies seemed to extend each year. Droughts, particularly in the south east of Britain became more frequent but also extended into Cymru. When Bill Mollison visited and taught at Ragman's Lane Farm in 1991, he was amazed that we weren't already on fire and I remember folk who attended courses I ran at home during the early summers remarking on how they had travelled up from the south through parched landscapes with only the trees showing green.
On the Mawddach the peak came when the two week window stretched to two months, an event almost unheard off, with just a dribble of rain in the middle. Further south, grass did not grow, turned yellow, then white and died. With no grazing for livestock and no silage crops to cut, emergency measures were introduced to provide forage for farmers. Reverting to an old practice, those fortunate enough to still have hedges, cut tree fodder for animals. Winters became warmer and practically devoid of snow. It all looked like this was global warming really kicking in.
And then, once again, having identified a trend of increasingly dry spring and early summer, it all changed and we had successive winters beginning 2010-2011 of heavy snow fall and intense cold. We were cut off for two four week periods, one before and one after the winter solstice, for two years running with temperatures below zero during the day and down to -13 at night, followed by wet weather pretty much throughout the rest of the year, again.
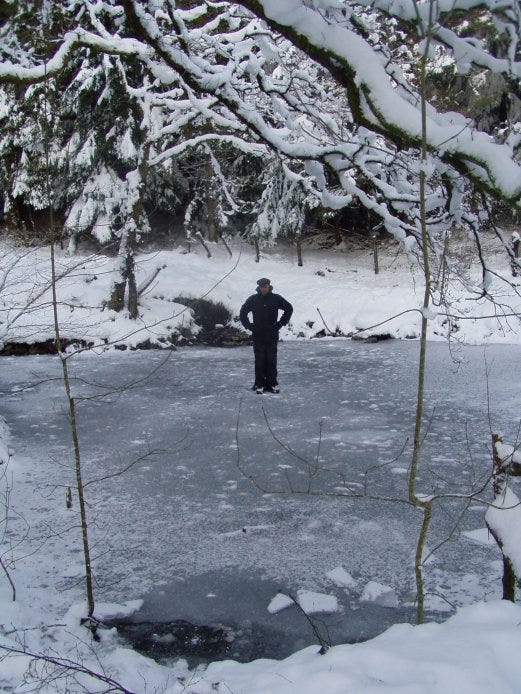
above: Fool on frozen pond (me…). The only time, so far, that this pond has frozen right over. Extremes will still occur.
What was going on? All this time, scientists, including climatologists and oceanographers had been studying weather patterns and learning more about the complexity of the Earth system and the inadequacies of computer modelling which were unable to incorporate even just the El Niño/La Niña cycle. So they had learned that not only does each ocean basin have its own periodic warming/cooling cycle but that as the oceans are really just one huge system, these individual cycles influence each other- teleconnected is the term. The complexity of these interacting cycles was beyond the ability of computers to model, and still is.
On top of this are atmospheric currents and cycles, intimately related to ocean currents, as of course its all one vast, amazing system. The sudden reappearance of those two harsh winters in the UK seemed to coincide with three of these large scale cycles entering their cooling phase at the same time, namely the Atlantic meridional overturning circulation (AMOC), the Arctic oscillation plus a solar warming/cooling cycle related to sunspots.
So the Earth's climate is hugely complex and we should expect wide variations and oscillations at a local level but what is clear from averaging temperature recordings from across the globe as a whole there is a steady increase in temperature, leading to regular breaking of national and global records.
I've continued drawing weather icons in my diaries for nearly forty years now and I am glad to be able to say that over the years I have introduced more objective measures of the weather (daily rainfall in millimetres, relative humidity and maximum and minimum temperatures) as well as regularly transferring those measurements into a digital format, namely a spreadsheet, this now being a task for those long winter evenings. The advantage of a spreadsheet is it allows for easier searching and presentation of the information in a variety of ways to allow simple comparisons from year to year or month to month and to produce five and ten year annual and monthly averages.
I encouraged all my students, visitors and apprentices to record at least their local rainfall. Its simple to do with a cheap rain gauge and encourages more awareness of weather generally and specific knowledge about your local climate.
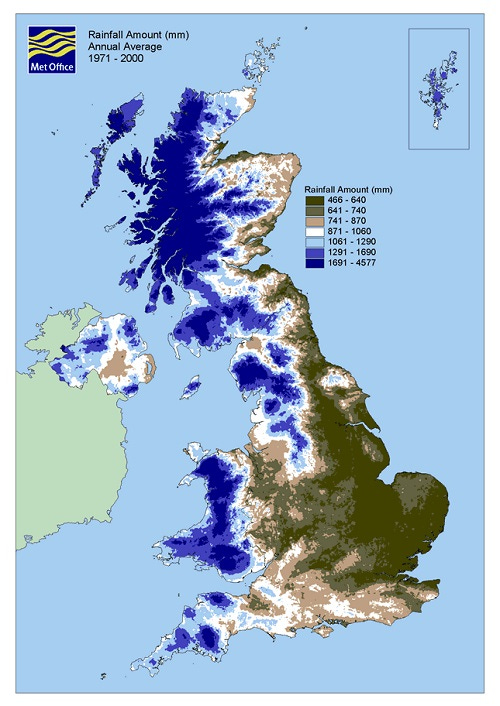
above: annual rainfall varies considerably across the UK.
One thing that will be obvious to most folk living in the Britain is that the weather is generally highly variable. This became very obvious to me after the first five years or so of taking daily rainfall measurements and working out annual totals. Now with several decades of measurements, I can see that our annual rainfall fluctuates between roughly 1.7 metre and 2.7 metres which is a considerable difference.
Here's the annual and monthly totals for 2023 compared to our ten year average.
above: annual rainfall for 2023 compared to ten year average.
The central column of figures gives the differences between rainfall in 2023 against the 10 year average for each month and for the year. Red figures indicate rainfall below average while black figures give the amount of rain above the average. So in 2023 rainfall was down in the first part of the year (especially so in February!) but higher during the autumn and winter months so the annual rainfall is close to the ten year average. This is in line with what scientists predict for global warming.
I was concerned that a ten year average might mask more recent changes so produced a five year average as well but found no appreciable difference, so I'm sticking with ten for now.
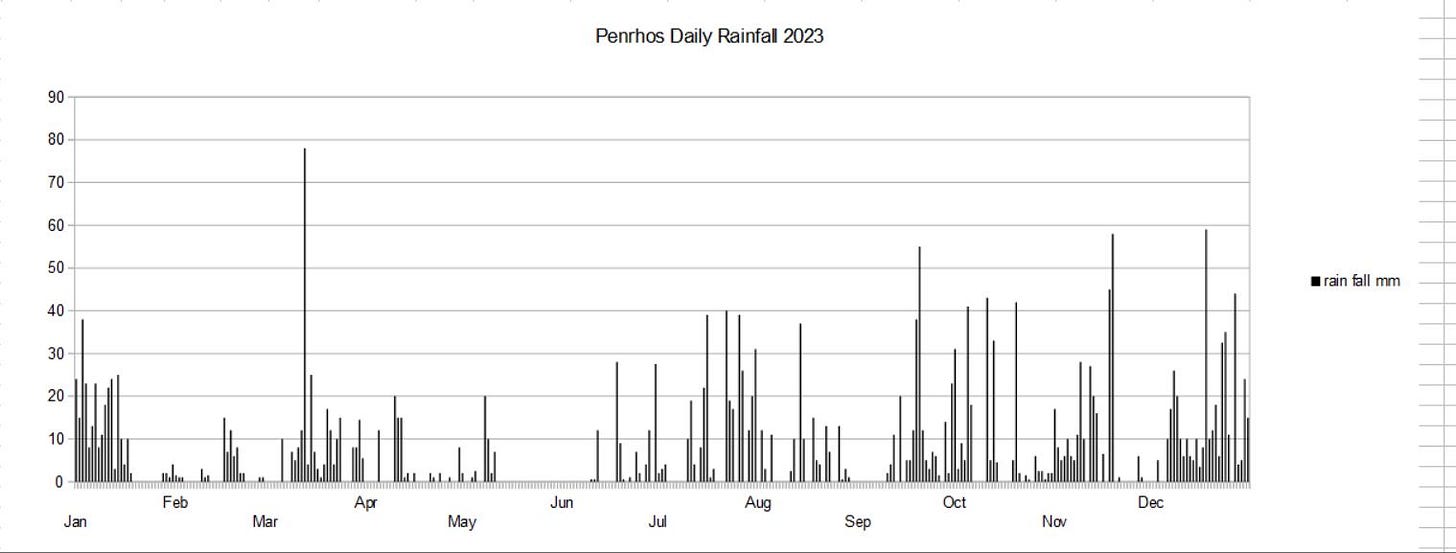
One of the things that bugs me with monthly totals, apart from the fact that months are ultimately arbitrary measures and of different lengths, is that it does not give any indication of how many days did not have rain. So I produced a different graph showing daily rainfall which provided me with good arguments to counter the “its rained all week” brigade.
above: graph showing daily rainfall and convincing proof that it does not rain “all the time”.
From this it should be clear that those regular western fronts of the 1980s bringing rain every 2, 3 or 4 days has vanished, replaced by longer bursts of persistent rain and longer intervals of dry weather between.
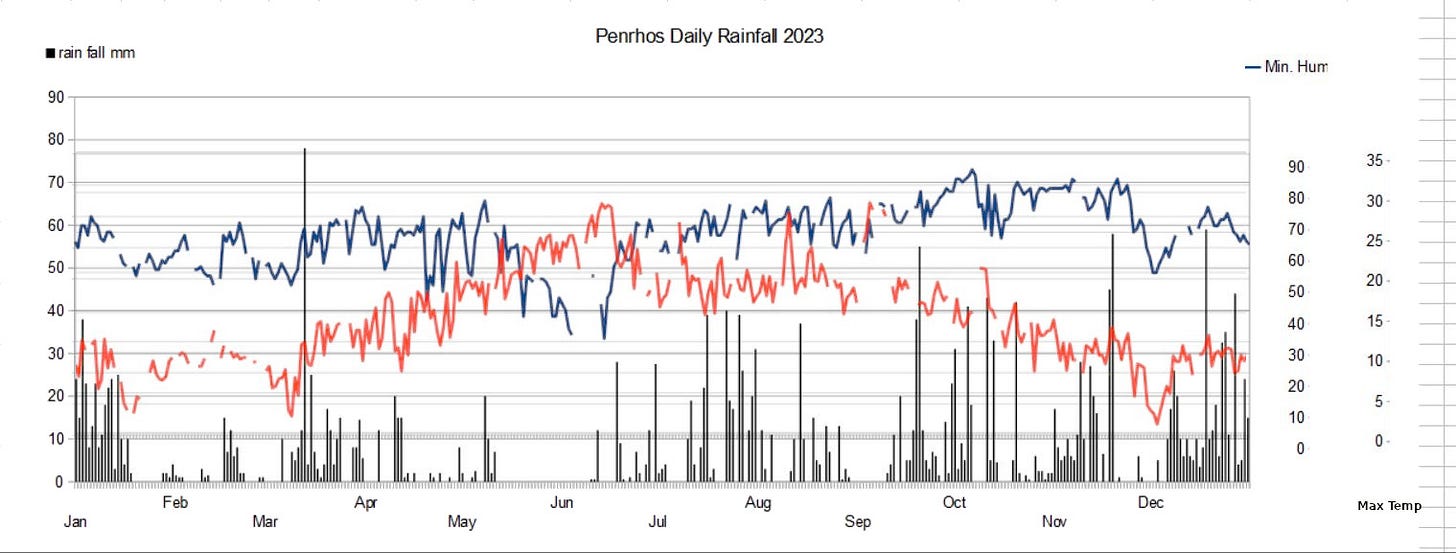
I've been trying to combine daily rainfall, minimum humidity and maximum temperatures into one graph, with limited success, however, here's my best attempt so far. Gaps in the blue line (minimum humidity) and red line (maximum temperatures) are where I forgot to note the readings...duh!.
above: an attempt at combining daily rainfall, minimum humidity and maximum temperature readings.
By overlaying the maximum temperature and the minimum humidity on rainfall we can see where the peak fire risk occurred, as humidity descends towards 30% and temperature climbs towards 30°. In 2023 this happened only once, towards the end of June, after several weeks without rain. Fortunately no fire kicked off in this instance.
above: rainfall figure for 2022; a scarier set of numbers.
If we look back at 2022 we see a starker picture with almost every month below the ten year average. Unsurprisingly this year saw a rack of records broken, being the hottest summer in Europe (coinciding with severe wild fires) and the second hottest in the UK (equalling 1995) and the hottest August in Europe. In the UK the 13th of November was the hottest on record with Porthmadog (twenty miles north of us|) registering a temperature of 21.2º, in November...a sign of things to come.
Fortunately 2023 was a relative let off in comparison, giving more time to prepare for wildfire. What this year, 2024 will bring seems very unpredictable. After a pretty wet start to the year with a lot of rain in February it has now begun to dry up though temperatures remain quite low with a strong risk of frosts at night. We shall see and I will continue to draw pictures in my diary and try to remember to note down all the various readings. I’ll also try to improve my graphs…
Thanks for reading. Next time I'll zoom in on Coed Y Brenin and what happens to all that rainfall after it hits the trees. A warm welcome to new subscribers. The newsletter has been and may well be prone to minor delays as this coincides with my busiest time in the garden and I am still catching up on firewood after the wet weather delayed my normal logging activities. More episodes of Konsk are in the pipeline and I will be putting out a note with links to all the previous episodes for any folk who may be interested in catching up.
Meanwhile, comments and suggestions always welcome, particularly any hints or pointers for combining multiple chart types in Open Office- many thanks! Till then, Hwyl! Chris.




Interesting observed accounts with a minimum of opinion. The facts sold the message
lovely stuff.... patterns & weather, weather patterns! Fascinating.